> ## Documentation Index
> Fetch the complete documentation index at: https://opensre.com/docs/llms.txt
> Use this file to discover all available pages before exploring further.
# How Tracer works, end to end
> A shared execution signal for analysis and optimization
Tracer is built to make execution behavior visible in compute-intensive environments, without changing workloads or relying on what applications choose to report.
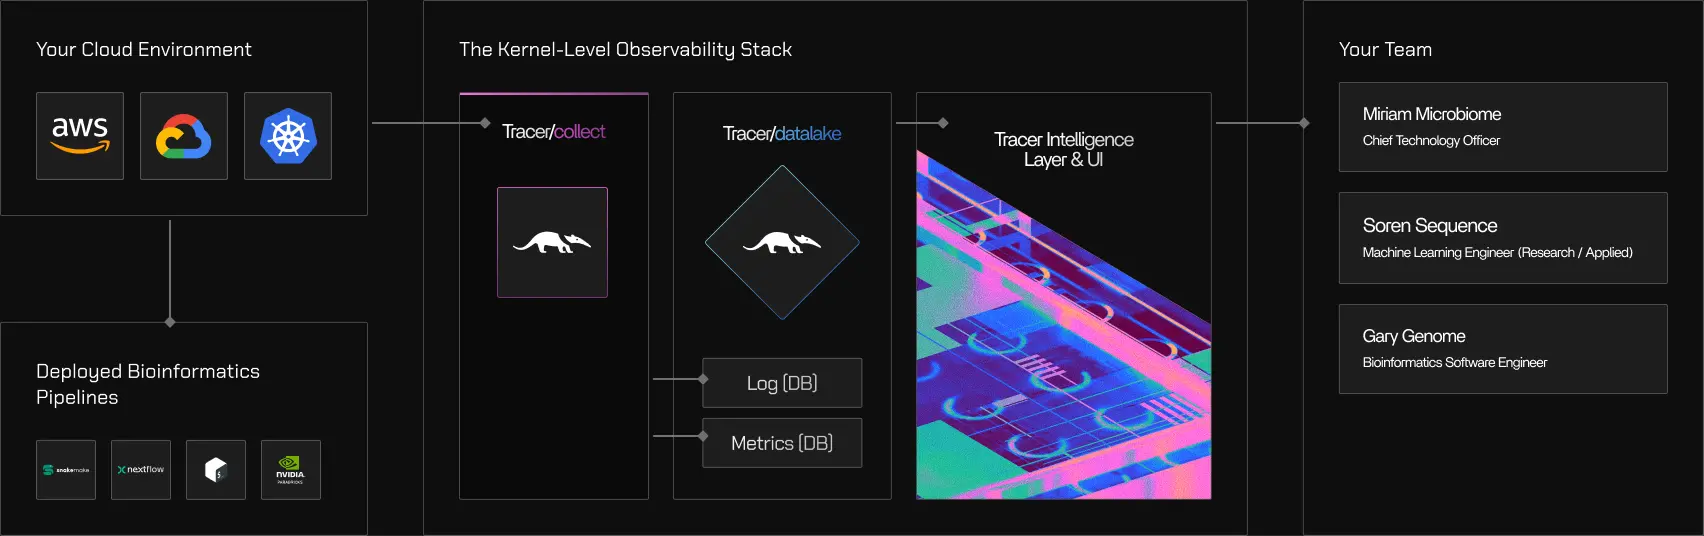
At a high level, Tracer works in three layers:
* **Tracer/collect**: an open-source eBPF agent that gathers execution signals from the host-layer
* **Tracer/datalake**: a shared execution view across pipelines and environments
* **Tracer/tune and Tracer/sweep**: use that signal to solve different problems
 This page explains the architecture. Each product page goes deeper on its specific behavior.
## What Tracer is made of
Tracer consists of three components with distinct responsibilities:
* **Tracer/collect** gathers execution signals directly from the operating system
* **Tracer/tune** uses those signals to analyze and optimize pipeline performance
* **Tracer/sweep** uses the same signals to uncover systemwide cloud waste
Tracer/collect is the foundation. Tracer/tune and Tracer/sweep are built on top of the execution signal it produces.
This page explains the architecture. Each product page goes deeper on its specific behavior.
## What Tracer is made of
Tracer consists of three components with distinct responsibilities:
* **Tracer/collect** gathers execution signals directly from the operating system
* **Tracer/tune** uses those signals to analyze and optimize pipeline performance
* **Tracer/sweep** uses the same signals to uncover systemwide cloud waste
Tracer/collect is the foundation. Tracer/tune and Tracer/sweep are built on top of the execution signal it produces.
 ## Architecture at a glance
Tracer's data flow can be understood in four stages:
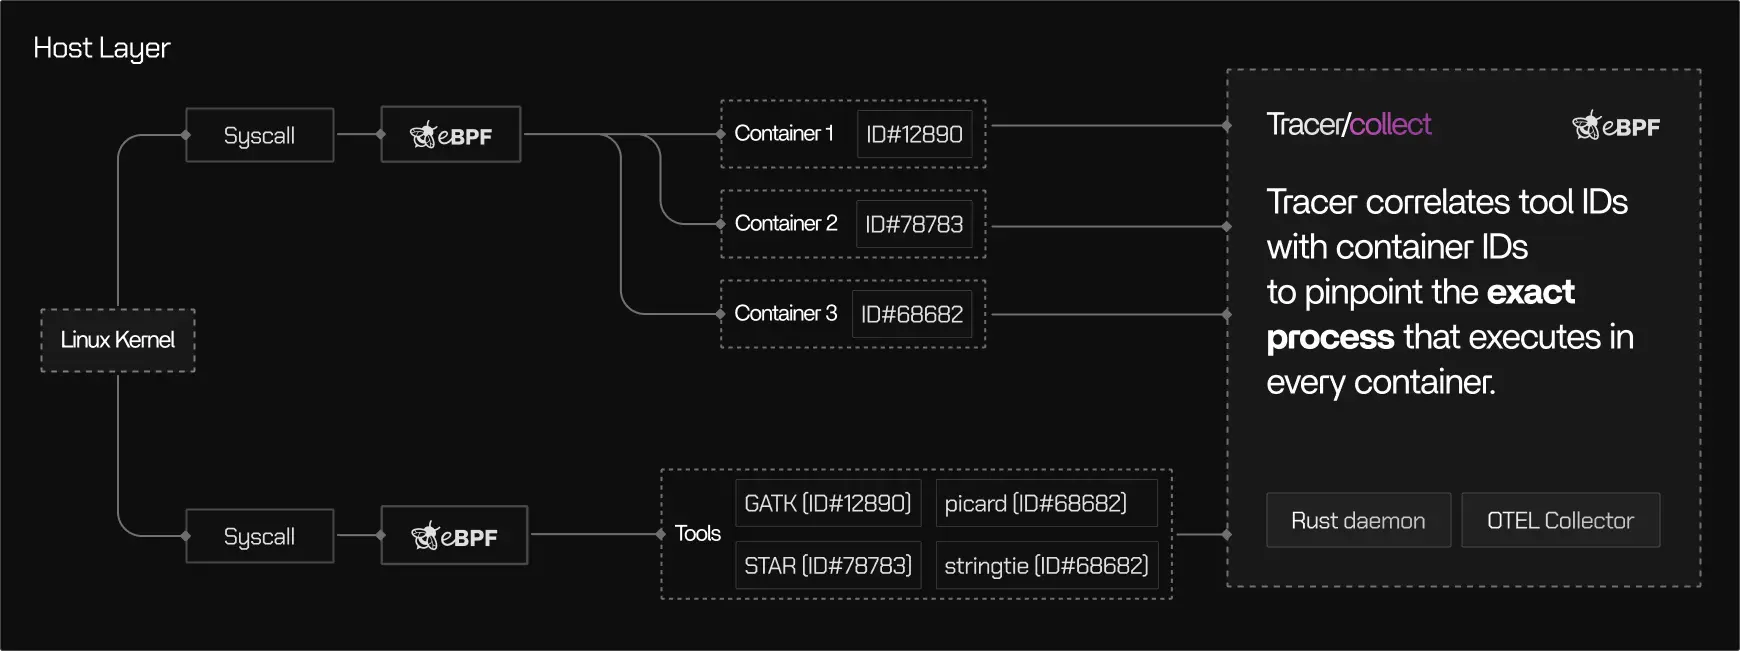
Tracer/collect attaches non-intrusively to running processes and containers on a Linux host using eBPF, a Linux kernel technology for safe, low-overhead instrumentation. No code changes, container restarts, or application modifications are required.
Execution events are captured at the kernel boundary, including CPU scheduling, memory activity, disk and network I/O, and process lifecycle events. Only relevant signals are selected through intelligent filtering rules.
Low-level events are mapped to higher-level execution context such as containers, tools, tasks, runs, and pipelines. This mapping uses kernel-native identifiers like PIDs, namespaces, and cgroups.
Structured telemetry is batched and sent securely to Tracer's backend, where it becomes available for analysis, visualization, and downstream products. Data is buffered locally and retried until successfully delivered.
This pipeline is continuous and designed to operate safely in production cloud compute environments.
## The execution signal (single source of truth)
Tracer's execution signal is a structured representation of what actually ran on the system.
It includes:
* CPU usage and scheduling behavior
* Memory allocation and pressure
* Disk and network I/O activity
* Process lifecycles and relationships
* Container and host context
**It explicitly does not include:**
* Application payloads or scientific input/output data
* Source code, function calls, or language-level execution traces
* Application- or domain-specific interpretation of what a command does
The execution signal is derived from kernel-level observation via eBPF, without application instrumentation or code changes. It serves as the shared input for both Tracer/tune and Tracer/sweep.
## How correlation works
Raw kernel events are not useful on their own. Tracer/collect correlates them into meaningful execution context.
At a high level:
* Kernel events are associated with processes
* Processes are grouped by containers and cgroups
* Containers and processes are mapped to tools, tasks, runs, and pipelines
This correlation allows Tracer to answer questions such as:
* Which tool generated this I/O?
* Which task was idle during this period?
* Which pipeline run consumed these resources?
All correlation is derived from operating system identifiers and execution context, not from workflow-specific integrations.
## Where Tracer/tune fits
Tracer/tune focuses on pipelines that already work, but are slow or inefficient.
Using the execution signal, Tracer/tune:
* Visualizes actual resource usage at the task and process level
* Identifies underutilization, contention, and bottlenecks
* Distinguishes compute-bound, memory-bound, and I/O-bound stages
* Produces evidence-based recommendations for right-sizing and optimization
Tracer/tune answers: **"How do we make this pipeline faster and cheaper?"**
Tracer/tune
## Architecture at a glance
Tracer's data flow can be understood in four stages:
Tracer/collect attaches non-intrusively to running processes and containers on a Linux host using eBPF, a Linux kernel technology for safe, low-overhead instrumentation. No code changes, container restarts, or application modifications are required.
Execution events are captured at the kernel boundary, including CPU scheduling, memory activity, disk and network I/O, and process lifecycle events. Only relevant signals are selected through intelligent filtering rules.
Low-level events are mapped to higher-level execution context such as containers, tools, tasks, runs, and pipelines. This mapping uses kernel-native identifiers like PIDs, namespaces, and cgroups.
Structured telemetry is batched and sent securely to Tracer's backend, where it becomes available for analysis, visualization, and downstream products. Data is buffered locally and retried until successfully delivered.
This pipeline is continuous and designed to operate safely in production cloud compute environments.
## The execution signal (single source of truth)
Tracer's execution signal is a structured representation of what actually ran on the system.
It includes:
* CPU usage and scheduling behavior
* Memory allocation and pressure
* Disk and network I/O activity
* Process lifecycles and relationships
* Container and host context
**It explicitly does not include:**
* Application payloads or scientific input/output data
* Source code, function calls, or language-level execution traces
* Application- or domain-specific interpretation of what a command does
The execution signal is derived from kernel-level observation via eBPF, without application instrumentation or code changes. It serves as the shared input for both Tracer/tune and Tracer/sweep.
## How correlation works
Raw kernel events are not useful on their own. Tracer/collect correlates them into meaningful execution context.
At a high level:
* Kernel events are associated with processes
* Processes are grouped by containers and cgroups
* Containers and processes are mapped to tools, tasks, runs, and pipelines
This correlation allows Tracer to answer questions such as:
* Which tool generated this I/O?
* Which task was idle during this period?
* Which pipeline run consumed these resources?
All correlation is derived from operating system identifiers and execution context, not from workflow-specific integrations.
## Where Tracer/tune fits
Tracer/tune focuses on pipelines that already work, but are slow or inefficient.
Using the execution signal, Tracer/tune:
* Visualizes actual resource usage at the task and process level
* Identifies underutilization, contention, and bottlenecks
* Distinguishes compute-bound, memory-bound, and I/O-bound stages
* Produces evidence-based recommendations for right-sizing and optimization
Tracer/tune answers: **"How do we make this pipeline faster and cheaper?"**
Tracer/tune
Learn more about pipeline performance optimization
## Where Tracer/sweep fits
Tracer/sweep focuses on systemwide cloud efficiency.
Using the same execution signal, Tracer/sweep:
* Scans cloud compute based on real execution activity
* Identifies idle time, unused capacity, and hidden inefficiencies
* Surfaces waste that does not appear in billing reports or dashboards
* Avoids predictive shutdown heuristics by relying on observed behavior
Tracer/sweep answers: **"Where are we wasting cloud spend right now?"**
Tracer/sweep
Learn more about cloud waste detection
## Choose your path
Depending on your goal, you can go deeper in different directions:
Tracer/collect
Learn how execution signals are captured safely and efficiently at the kernel level.
Tracer/tune
Learn how Tracer turns execution data into pipeline performance insights and recommendations.
Tracer/sweep
Learn how Tracer uncovers cloud waste using real activity patterns.