> ## Documentation Index
> Fetch the complete documentation index at: https://opensre.com/docs/llms.txt
> Use this file to discover all available pages before exploring further.
# Grafana
> Connect Grafana so OpenSRE can query metrics, dashboards, and alerts
## Overview
OpenSRE queries Grafana (Cloud or self-hosted) for logs, metrics, traces, alert rules, and annotations. For a local Minikube lab with Prometheus and a sample app, see [Extras](#extras).
## Prerequisites
* Grafana instance URL (Cloud stack URL or self-hosted origin)
* Service account token with read access — see [Credentials](#credentials)
## Setup
### Option 1: Interactive CLI
```bash theme={null}
opensre integrations setup grafana
```
Provide the instance URL and service account token when prompted.
### Option 2: Environment variables
```bash theme={null}
GRAFANA_INSTANCE_URL=https://your-stack.grafana.net
GRAFANA_READ_TOKEN=glsa_your_service_account_token
GRAFANA_VERIFY_SSL=true # optional — set false only for local/lab
GRAFANA_CA_BUNDLE=/path/to/internal-ca.pem # optional — internal CA
```
| Variable | Default | Description |
| ---------------------- | ------- | ---------------------------------------------------------- |
| `GRAFANA_INSTANCE_URL` | — | **Required.** Grafana base URL |
| `GRAFANA_READ_TOKEN` | — | **Required.** Service account token |
| `GRAFANA_VERIFY_SSL` | `true` | Set `false` to skip TLS verification (lab only) |
| `GRAFANA_CA_BUNDLE` | — | PEM file for private CA (recommended for internal Grafana) |
For prod/staging pairs, use `GRAFANA_INSTANCES` — see [Multi-instance integrations](/docs/platform/multi-instance-integrations).
### Option 3: Persistent store
```json theme={null}
{
"version": 1,
"integrations": [
{
"id": "grafana-prod",
"service": "grafana",
"status": "active",
"credentials": {
"endpoint": "https://your-stack.grafana.net",
"api_key": "glsa_your_token",
"verify_ssl": true
}
}
]
}
```
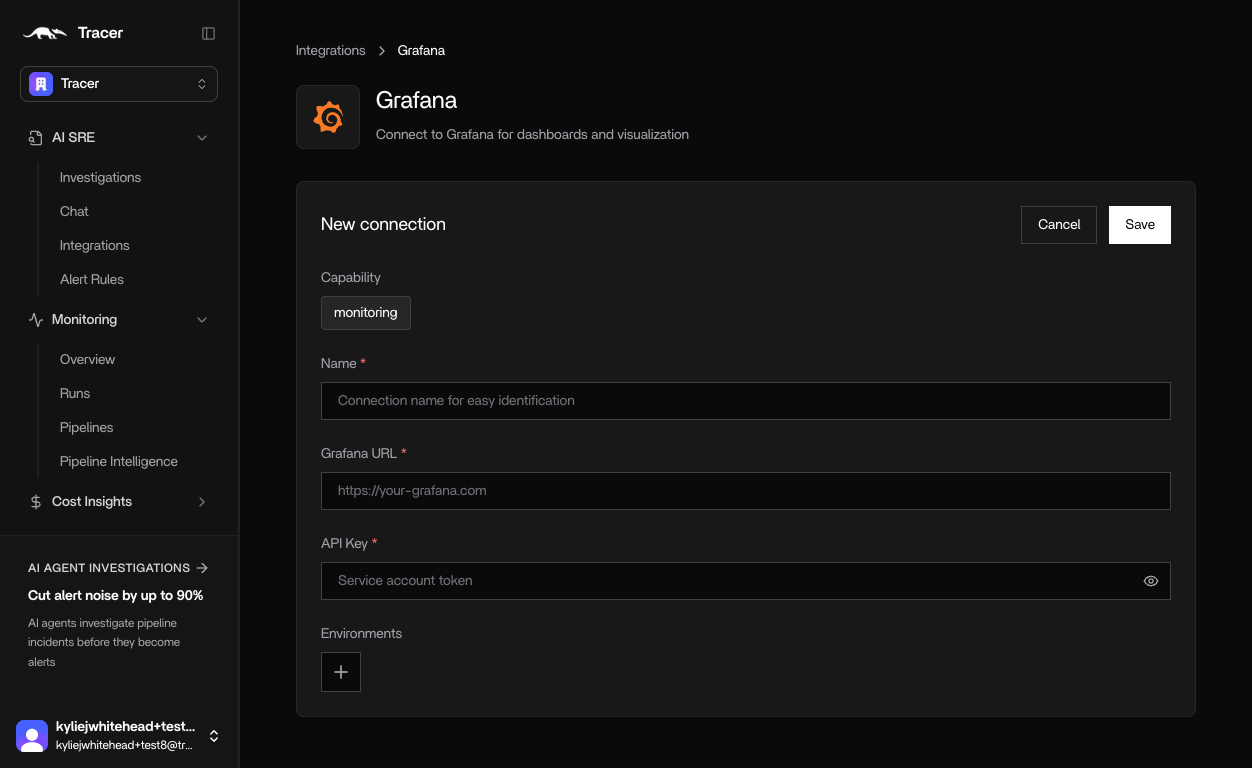
### Option 4: Hosted web app (OpenSRE Cloud)
Hosted OpenSRE Cloud is **coming soon**. Until then, use the local CLI, environment variables, or persistent store above.
When available, organization-wide Grafana connectors will be configured in the hosted web app:
1. In [app.opensre.com](https://app.opensre.com), go to **Integrations** → **Grafana**
2. Enter a name, instance URL, and service account token
3. Click **Save**
 ### Self-signed or internal CA certificates
If Grafana uses a certificate signed by an internal CA, `opensre integrations setup grafana` prompts for:
| Prompt | When to use it |
| ------------------------------------------ | ------------------------------------------------------------------------------------------------------ |
| **Verify SSL certificate?** | Answer `No` only for local/lab instances (skips TLS verification) |
| **Path to CA bundle for SSL verification** | Point at a PEM file with your internal CA — keeps full TLS checks; preferred for real internal Grafana |
You can also set these in `.env`:
| Variable | Purpose |
| -------------------- | ----------------------- |
| `GRAFANA_VERIFY_SSL` | `true` / `false` |
| `GRAFANA_CA_BUNDLE` | Path to a PEM CA bundle |
## Credentials
Create a Grafana service account token with read access. See [Grafana service account tokens](https://grafana.com/docs/grafana/latest/administration/service-accounts/#add-a-token-to-a-service-account-in-grafana).
1. In Grafana, open **Administration** → **Service accounts** (or your stack’s equivalent).
2. Create a service account with read access to the datasources you want OpenSRE to query.
3. Add a token to that service account and copy it (shown once).
Use this value as `GRAFANA_READ_TOKEN` (CLI prompt: service account token).
## Tools
| Tool | Use it for |
| ----------------------------- | -------------------------------------------------------- |
| `query_grafana_logs` | Loki log streams for a known `service_name` |
| `query_grafana_metrics` | Mimir / Prometheus-style metrics |
| `query_grafana_traces` | Tempo traces through the Grafana datasource proxy |
| `query_grafana_alert_rules` | Alert rule configuration and thresholds |
| `query_grafana_service_names` | Discover Loki `service_name` labels before querying logs |
Deployment and config-change markers are covered on [Grafana Annotations](/docs/integrations/monitoring/grafana_annotations). For standalone Tempo (no Grafana proxy), see [Grafana Tempo](/docs/integrations/monitoring/tempo).
## Verify
```bash theme={null}
opensre integrations verify grafana
```
## Troubleshooting
| Symptom | Fix |
| ---------------------------- | ------------------------------------------------------------------------------------------------------------------------------ |
| **TLS / certificate errors** | For lab only, set `GRAFANA_VERIFY_SSL=false`. For internal Grafana, set `GRAFANA_CA_BUNDLE` to a PEM with your CA (preferred). |
| **Auth failures** | Confirm the service account token is valid and has read access to the target datasources. |
| **Multiple Grafana stacks** | Use `GRAFANA_INSTANCES` — see [Multi-instance integrations](/docs/platform/multi-instance-integrations). |
## Security
* Prefer a dedicated service account token with read-only access.
* Prefer `GRAFANA_CA_BUNDLE` over disabling TLS verification for real internal Grafana.
* Set `GRAFANA_VERIFY_SSL=false` only for local/lab instances.
* Store tokens in `.env` or your secret manager — not in source control.
## Extras
### Local Grafana setup (Minikube example)
Use this lab to run Grafana, Prometheus, and a sample app locally, then connect OpenSRE.
#### Steps
1. Start Minikube:
```bash theme={null}
minikube start
```
2. Add Helm repositories and update:
```bash theme={null}
helm repo add prometheus-community https://prometheus-community.github.io/helm-charts
helm repo add podinfo https://stefanprodan.github.io/podinfo
helm repo update
```
3. Install the kube-prometheus stack:
```bash theme={null}
kubectl create namespace monitoring
helm install kube-stack prometheus-community/kube-prometheus-stack -n monitoring
```
4. Install the podinfo sample app:
```bash theme={null}
kubectl create namespace podinfo
helm install podinfo podinfo/podinfo -n podinfo --set serviceMonitor.enabled=true
```
5. (Optional) Check pods:
```bash theme={null}
kubectl -n podinfo get pods
kubectl -n monitoring get pods
```
6. Port-forward podinfo (separate terminal):
```bash theme={null}
kubectl -n podinfo port-forward deploy/podinfo 8080:9898
```
7. Port-forward Prometheus (separate terminal):
```bash theme={null}
kubectl -n monitoring port-forward svc/kube-stack-kube-prometheus-prometheus 9090:9090
```
8. Port-forward Grafana on all interfaces (separate terminal):
```bash theme={null}
kubectl -n monitoring port-forward --address 0.0.0.0 svc/kube-stack-grafana 3000:80
```
9. Allow Prometheus to scrape podinfo ServiceMonitors:
```bash theme={null}
kubectl patch prometheus kube-stack-kube-prometheus-prometheus \
-n monitoring \
--type=json \
-p '[{"op":"replace","path":"/spec/serviceMonitorSelector","value":{}}]'
kubectl patch prometheus kube-stack-kube-prometheus-prometheus \
-n monitoring \
--type=json \
-p '[{"op":"replace","path":"/spec/serviceMonitorNamespaceSelector","value":{}}]'
```
A JSON **merge** patch (`--type=merge`) with `{}` for a nested object field is a
no-op, not a replacement -- RFC 7396 merge-patch semantics only remove keys set to
`null`; an empty object leaves the existing `matchLabels: {release: kube-stack}`
in place, so podinfo's ServiceMonitor (which carries no such label) never gets
scraped and this step silently does nothing. Confirmed live: `kubectl patch --type=merge` here reports `"patched (no change)"`, and `podinfo` never appears
in `http://localhost:9090/api/v1/targets` until switched to `--type=json` with an
explicit `replace` operation.
#### Grafana credentials
Get the admin password:
```bash theme={null}
kubectl get secret kube-stack-grafana --namespace monitoring -o jsonpath="{.data.admin-password}" | base64 --decode ; echo
```
Username is `admin`; password is the command output.
#### Access
| Service | URL |
| ---------- | ---------------------------------------------- |
| podinfo | [http://localhost:8080](http://localhost:8080) |
| Prometheus | [http://localhost:9090](http://localhost:9090) |
| Grafana | [http://localhost:3000](http://localhost:3000) |
#### Simulate load
```bash theme={null}
while true; do curl -s http://localhost:8080/status/500 >/dev/null; sleep 1; done &
while true; do curl -s http://localhost:8080/delay/5 >/dev/null; sleep 1; done &
```
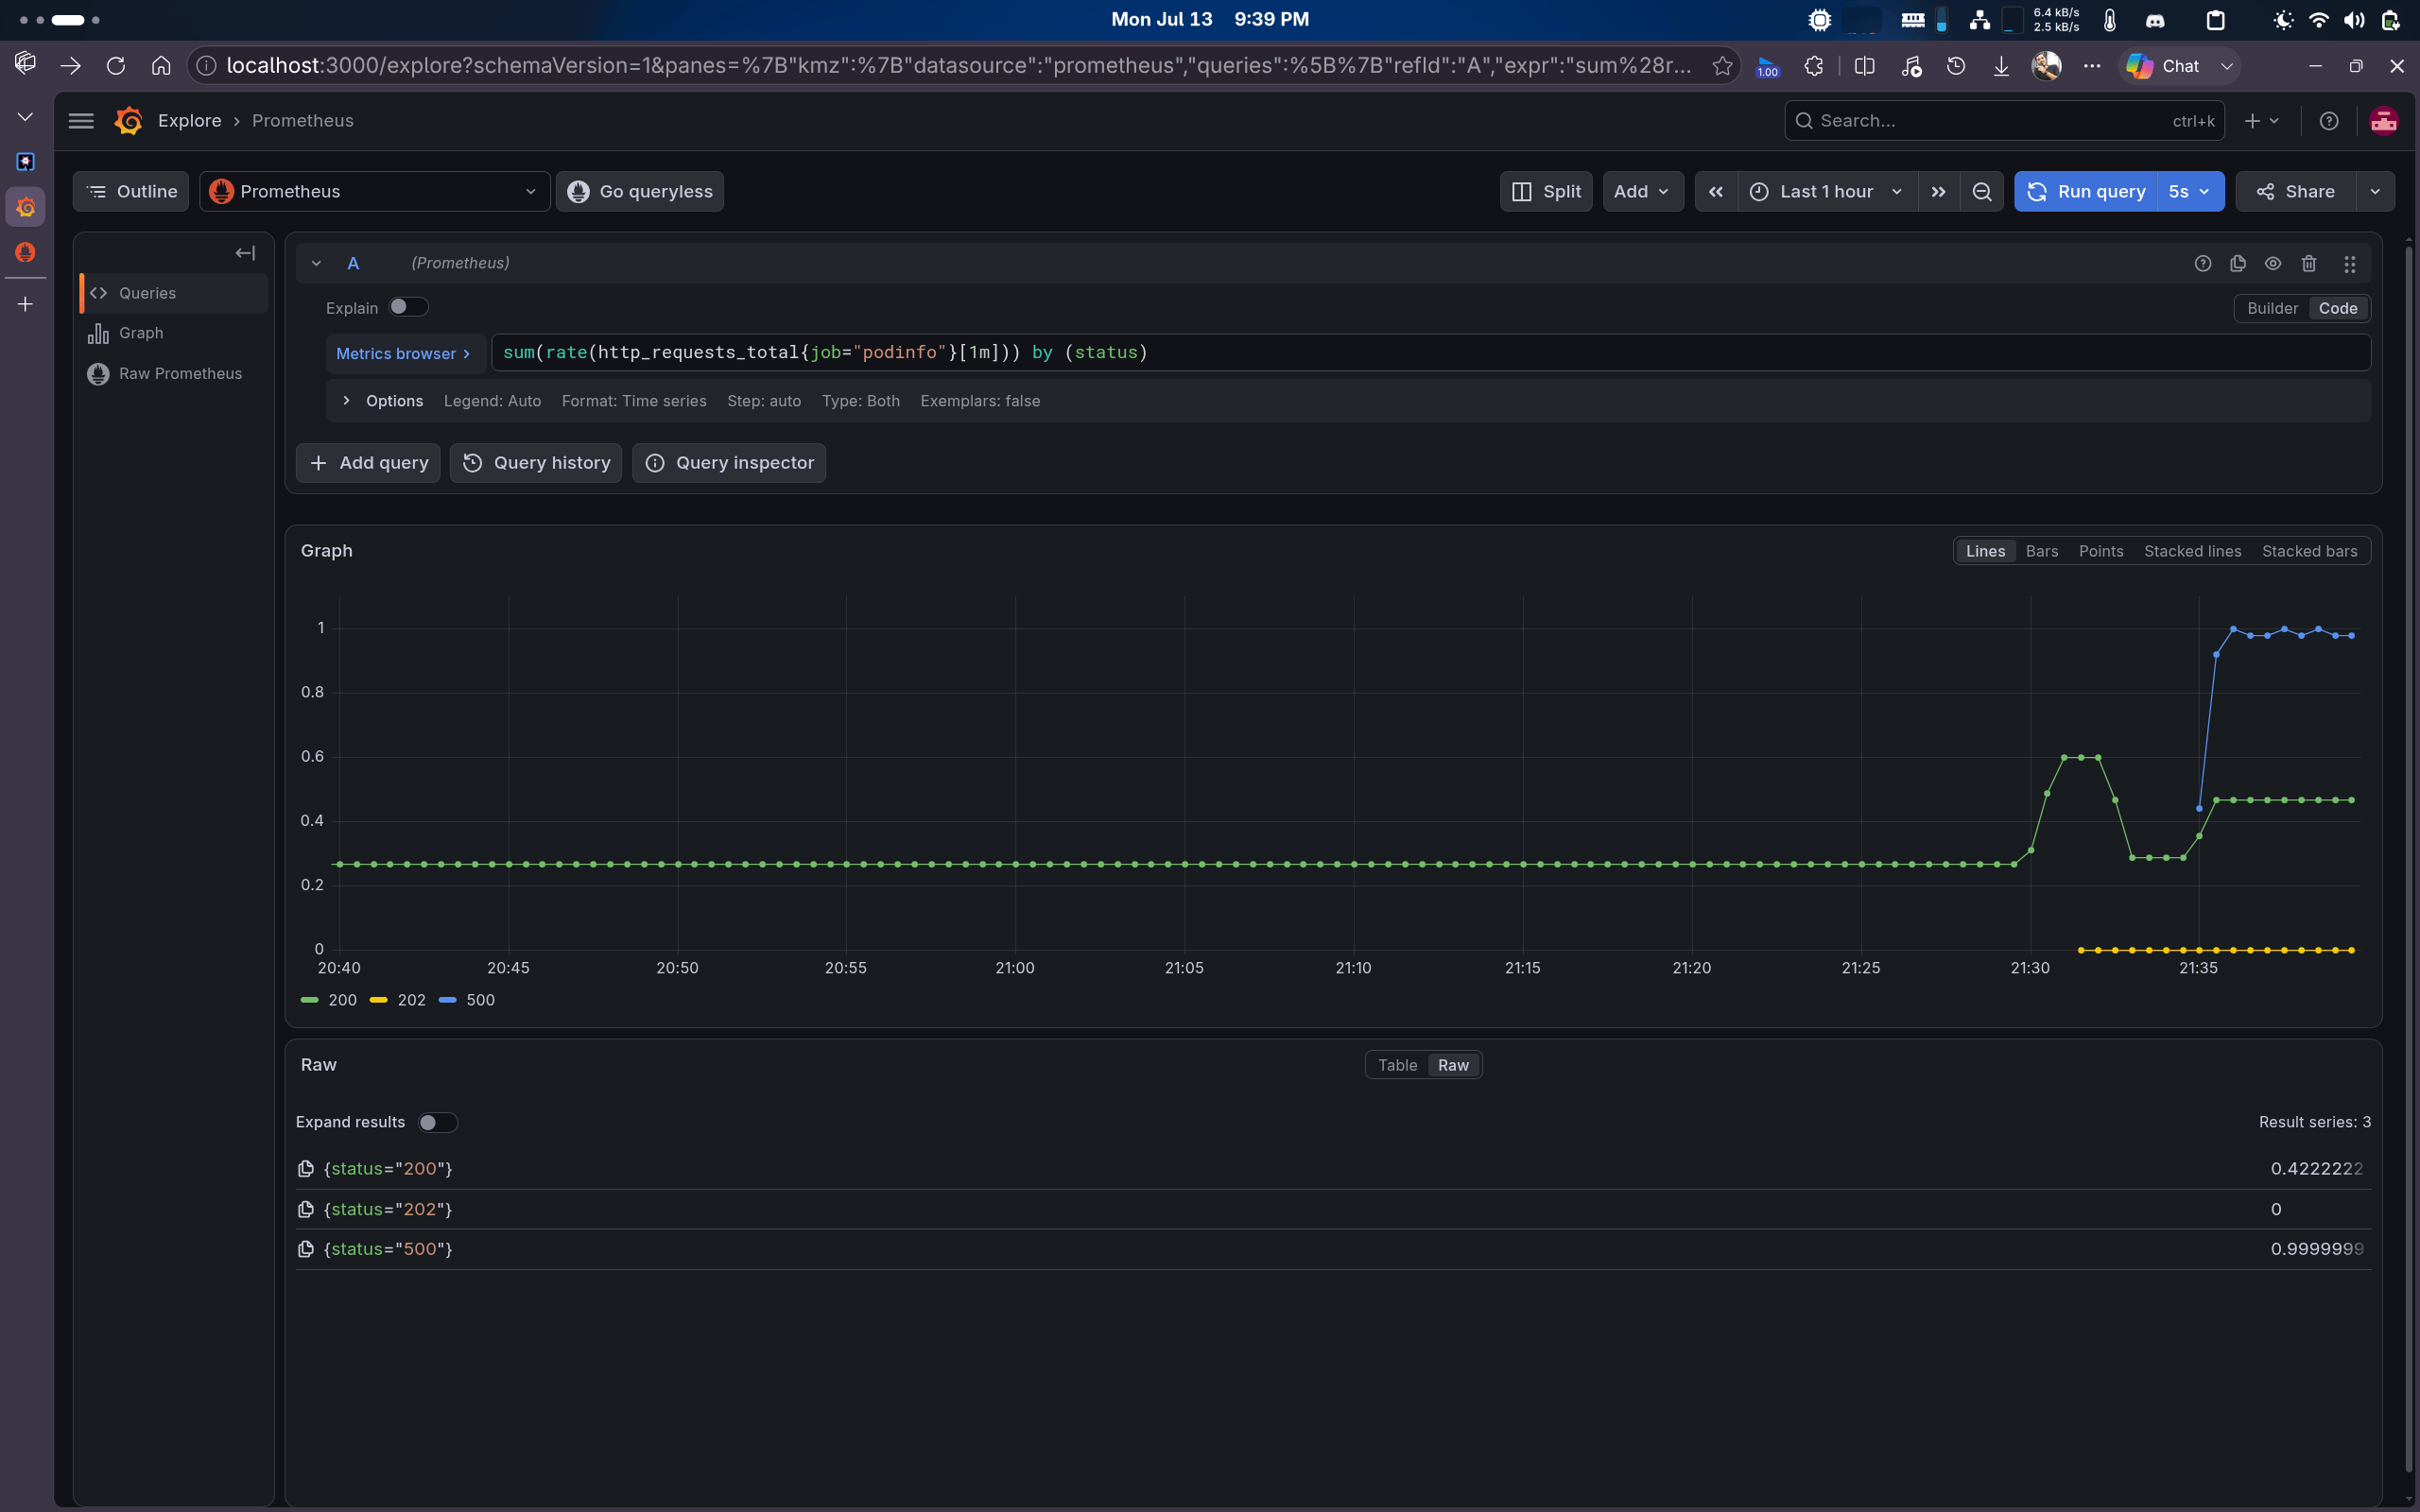
#### Sample Grafana queries
Request rate by status:
```promql theme={null}
sum(rate(http_requests_total{job="podinfo"}[1m])) by (status)
```
p95 latency:
```promql theme={null}
histogram_quantile(0.95, sum(rate(http_request_duration_seconds_bucket{job="podinfo"}[1m])) by (le))
```
### Self-signed or internal CA certificates
If Grafana uses a certificate signed by an internal CA, `opensre integrations setup grafana` prompts for:
| Prompt | When to use it |
| ------------------------------------------ | ------------------------------------------------------------------------------------------------------ |
| **Verify SSL certificate?** | Answer `No` only for local/lab instances (skips TLS verification) |
| **Path to CA bundle for SSL verification** | Point at a PEM file with your internal CA — keeps full TLS checks; preferred for real internal Grafana |
You can also set these in `.env`:
| Variable | Purpose |
| -------------------- | ----------------------- |
| `GRAFANA_VERIFY_SSL` | `true` / `false` |
| `GRAFANA_CA_BUNDLE` | Path to a PEM CA bundle |
## Credentials
Create a Grafana service account token with read access. See [Grafana service account tokens](https://grafana.com/docs/grafana/latest/administration/service-accounts/#add-a-token-to-a-service-account-in-grafana).
1. In Grafana, open **Administration** → **Service accounts** (or your stack’s equivalent).
2. Create a service account with read access to the datasources you want OpenSRE to query.
3. Add a token to that service account and copy it (shown once).
Use this value as `GRAFANA_READ_TOKEN` (CLI prompt: service account token).
## Tools
| Tool | Use it for |
| ----------------------------- | -------------------------------------------------------- |
| `query_grafana_logs` | Loki log streams for a known `service_name` |
| `query_grafana_metrics` | Mimir / Prometheus-style metrics |
| `query_grafana_traces` | Tempo traces through the Grafana datasource proxy |
| `query_grafana_alert_rules` | Alert rule configuration and thresholds |
| `query_grafana_service_names` | Discover Loki `service_name` labels before querying logs |
Deployment and config-change markers are covered on [Grafana Annotations](/docs/integrations/monitoring/grafana_annotations). For standalone Tempo (no Grafana proxy), see [Grafana Tempo](/docs/integrations/monitoring/tempo).
## Verify
```bash theme={null}
opensre integrations verify grafana
```
## Troubleshooting
| Symptom | Fix |
| ---------------------------- | ------------------------------------------------------------------------------------------------------------------------------ |
| **TLS / certificate errors** | For lab only, set `GRAFANA_VERIFY_SSL=false`. For internal Grafana, set `GRAFANA_CA_BUNDLE` to a PEM with your CA (preferred). |
| **Auth failures** | Confirm the service account token is valid and has read access to the target datasources. |
| **Multiple Grafana stacks** | Use `GRAFANA_INSTANCES` — see [Multi-instance integrations](/docs/platform/multi-instance-integrations). |
## Security
* Prefer a dedicated service account token with read-only access.
* Prefer `GRAFANA_CA_BUNDLE` over disabling TLS verification for real internal Grafana.
* Set `GRAFANA_VERIFY_SSL=false` only for local/lab instances.
* Store tokens in `.env` or your secret manager — not in source control.
## Extras
### Local Grafana setup (Minikube example)
Use this lab to run Grafana, Prometheus, and a sample app locally, then connect OpenSRE.
#### Steps
1. Start Minikube:
```bash theme={null}
minikube start
```
2. Add Helm repositories and update:
```bash theme={null}
helm repo add prometheus-community https://prometheus-community.github.io/helm-charts
helm repo add podinfo https://stefanprodan.github.io/podinfo
helm repo update
```
3. Install the kube-prometheus stack:
```bash theme={null}
kubectl create namespace monitoring
helm install kube-stack prometheus-community/kube-prometheus-stack -n monitoring
```
4. Install the podinfo sample app:
```bash theme={null}
kubectl create namespace podinfo
helm install podinfo podinfo/podinfo -n podinfo --set serviceMonitor.enabled=true
```
5. (Optional) Check pods:
```bash theme={null}
kubectl -n podinfo get pods
kubectl -n monitoring get pods
```
6. Port-forward podinfo (separate terminal):
```bash theme={null}
kubectl -n podinfo port-forward deploy/podinfo 8080:9898
```
7. Port-forward Prometheus (separate terminal):
```bash theme={null}
kubectl -n monitoring port-forward svc/kube-stack-kube-prometheus-prometheus 9090:9090
```
8. Port-forward Grafana on all interfaces (separate terminal):
```bash theme={null}
kubectl -n monitoring port-forward --address 0.0.0.0 svc/kube-stack-grafana 3000:80
```
9. Allow Prometheus to scrape podinfo ServiceMonitors:
```bash theme={null}
kubectl patch prometheus kube-stack-kube-prometheus-prometheus \
-n monitoring \
--type=json \
-p '[{"op":"replace","path":"/spec/serviceMonitorSelector","value":{}}]'
kubectl patch prometheus kube-stack-kube-prometheus-prometheus \
-n monitoring \
--type=json \
-p '[{"op":"replace","path":"/spec/serviceMonitorNamespaceSelector","value":{}}]'
```
A JSON **merge** patch (`--type=merge`) with `{}` for a nested object field is a
no-op, not a replacement -- RFC 7396 merge-patch semantics only remove keys set to
`null`; an empty object leaves the existing `matchLabels: {release: kube-stack}`
in place, so podinfo's ServiceMonitor (which carries no such label) never gets
scraped and this step silently does nothing. Confirmed live: `kubectl patch --type=merge` here reports `"patched (no change)"`, and `podinfo` never appears
in `http://localhost:9090/api/v1/targets` until switched to `--type=json` with an
explicit `replace` operation.
#### Grafana credentials
Get the admin password:
```bash theme={null}
kubectl get secret kube-stack-grafana --namespace monitoring -o jsonpath="{.data.admin-password}" | base64 --decode ; echo
```
Username is `admin`; password is the command output.
#### Access
| Service | URL |
| ---------- | ---------------------------------------------- |
| podinfo | [http://localhost:8080](http://localhost:8080) |
| Prometheus | [http://localhost:9090](http://localhost:9090) |
| Grafana | [http://localhost:3000](http://localhost:3000) |
#### Simulate load
```bash theme={null}
while true; do curl -s http://localhost:8080/status/500 >/dev/null; sleep 1; done &
while true; do curl -s http://localhost:8080/delay/5 >/dev/null; sleep 1; done &
```
#### Sample Grafana queries
Request rate by status:
```promql theme={null}
sum(rate(http_requests_total{job="podinfo"}[1m])) by (status)
```
p95 latency:
```promql theme={null}
histogram_quantile(0.95, sum(rate(http_request_duration_seconds_bucket{job="podinfo"}[1m])) by (le))
```
 #### Prometheus alert for high error rate
```bash theme={null}
kubectl apply -f - <<'YAML'
apiVersion: monitoring.coreos.com/v1
kind: PrometheusRule
metadata:
name: podinfo-alerts
namespace: monitoring
labels:
release: kube-stack
spec:
groups:
- name: podinfo.rules
rules:
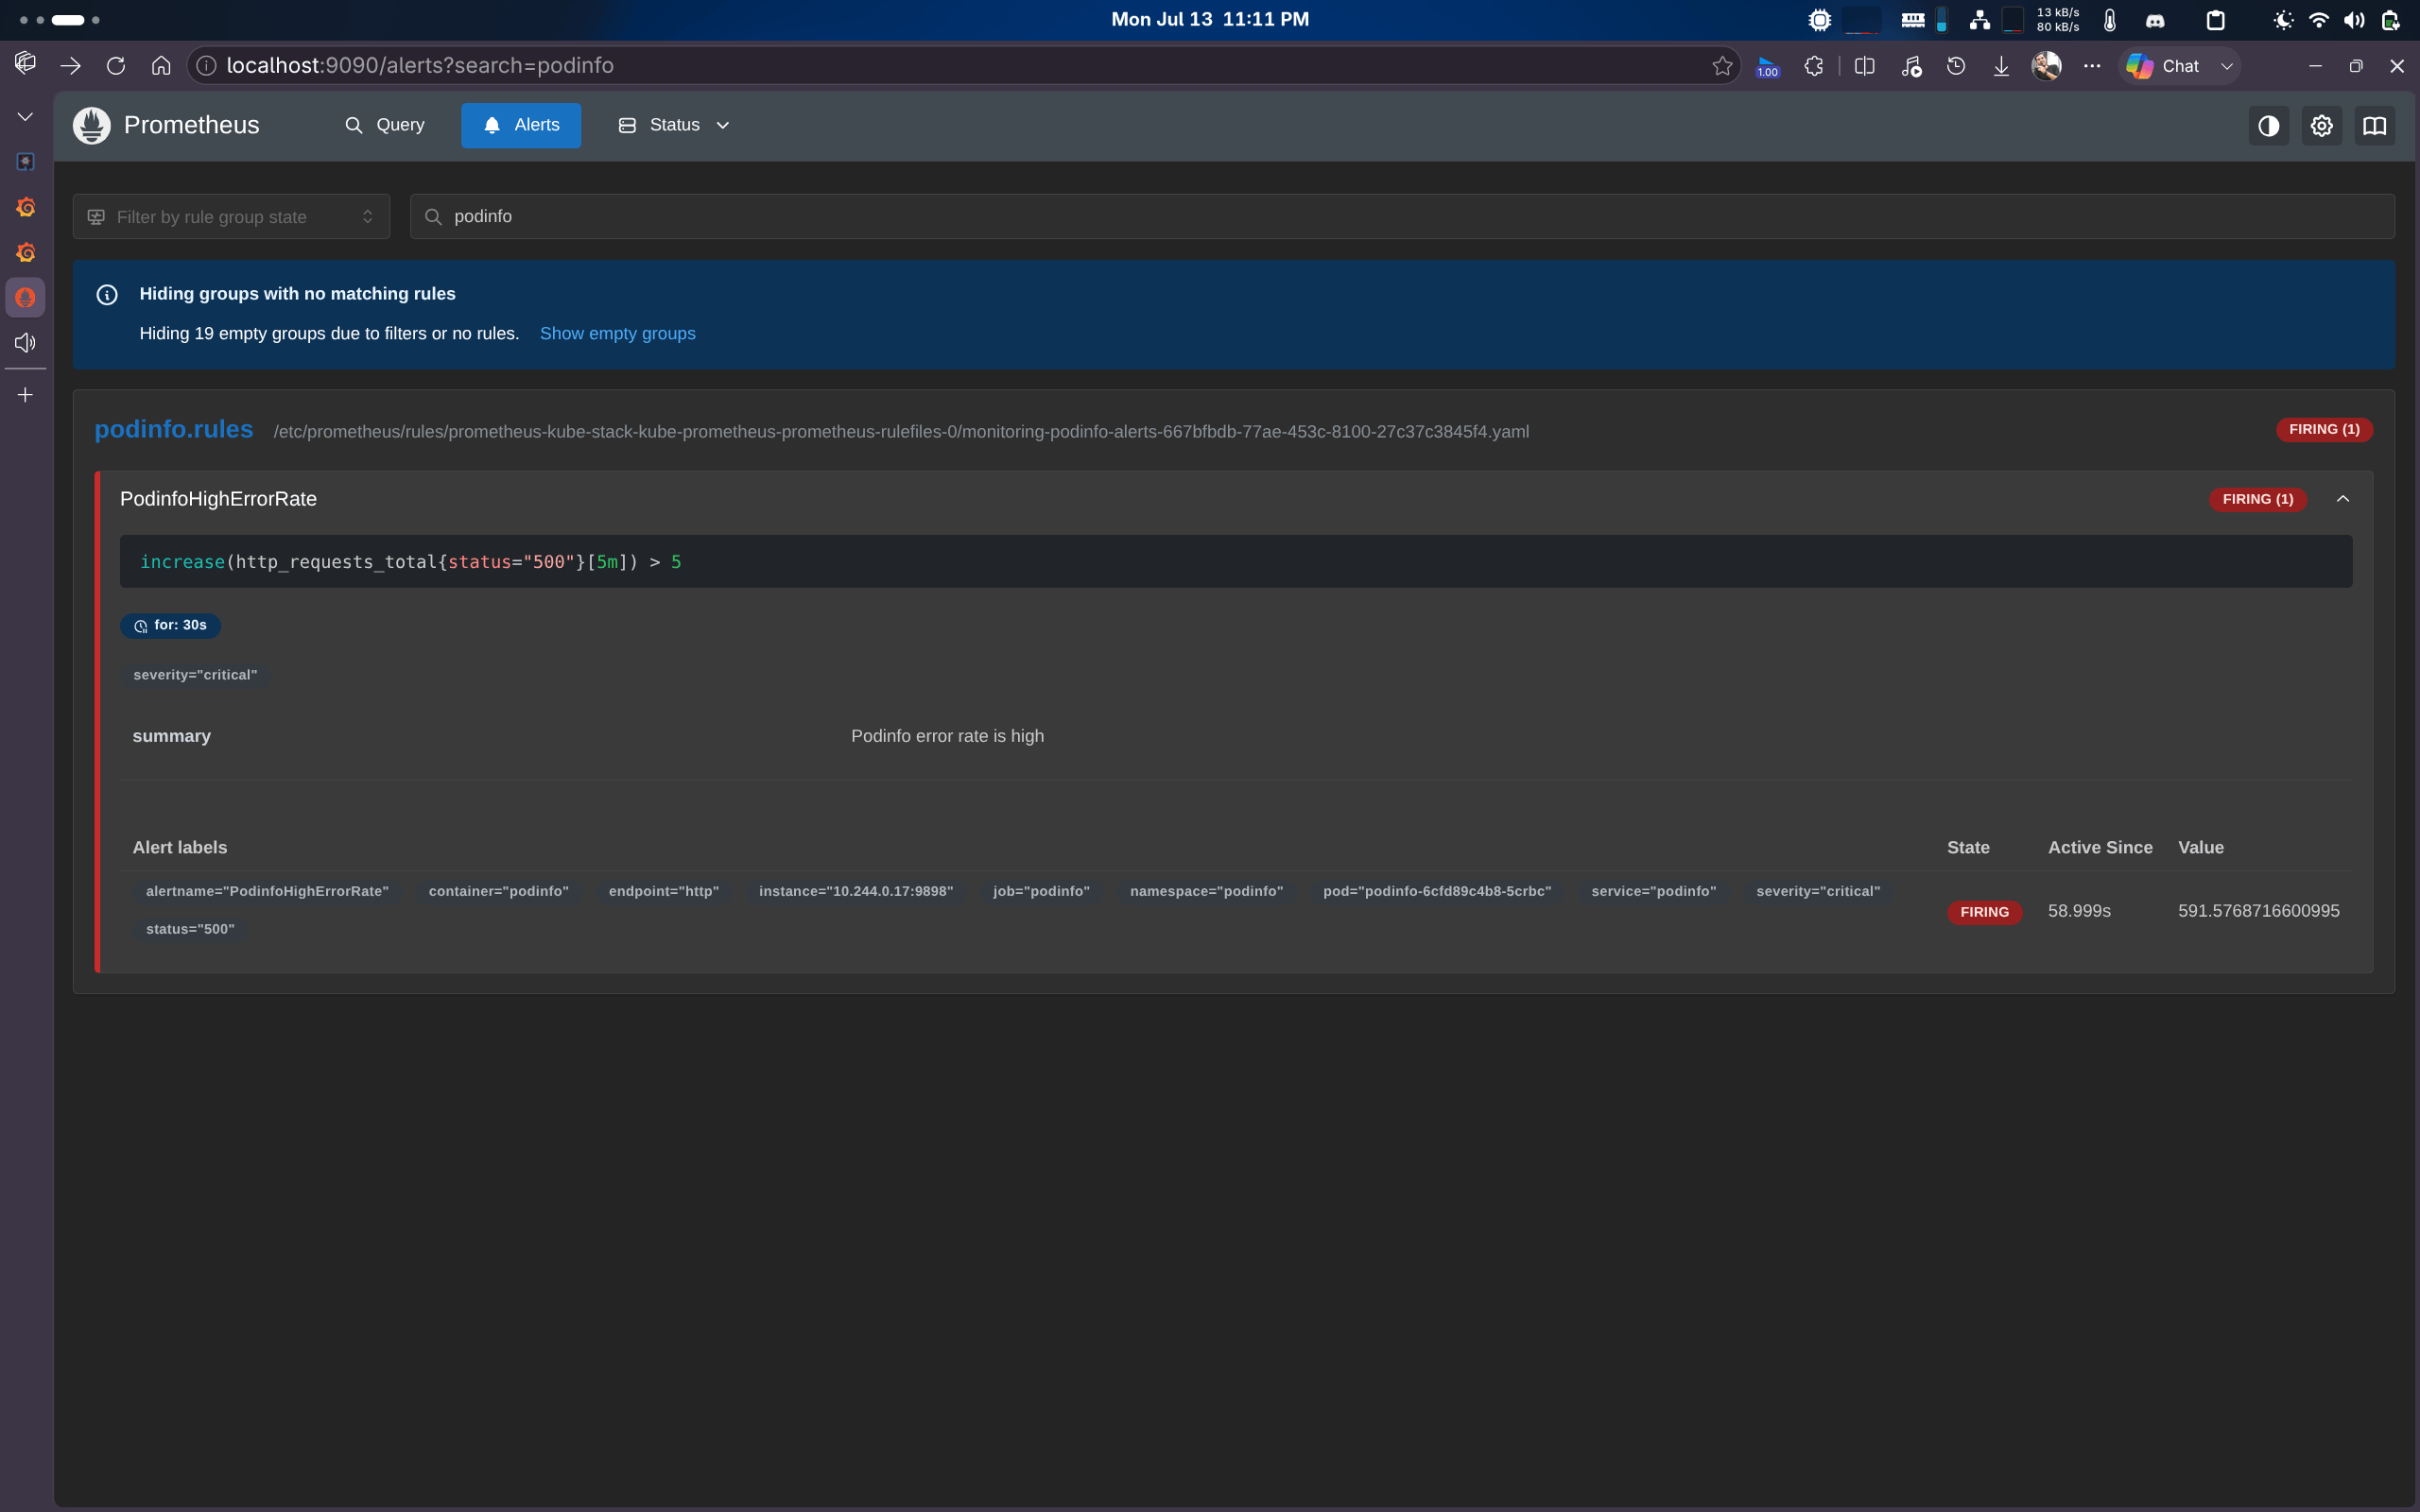
- alert: PodinfoHighErrorRate
expr: increase(http_requests_total{status="500"}[5m]) > 5
for: 30s
labels:
severity: critical
annotations:
summary: "Podinfo error rate is high"
YAML
```
The alert fires after about 30 seconds of elevated errors. Check [http://localhost:9090/alerts](http://localhost:9090/alerts).
#### Prometheus alert for high error rate
```bash theme={null}
kubectl apply -f - <<'YAML'
apiVersion: monitoring.coreos.com/v1
kind: PrometheusRule
metadata:
name: podinfo-alerts
namespace: monitoring
labels:
release: kube-stack
spec:
groups:
- name: podinfo.rules
rules:
- alert: PodinfoHighErrorRate
expr: increase(http_requests_total{status="500"}[5m]) > 5
for: 30s
labels:
severity: critical
annotations:
summary: "Podinfo error rate is high"
YAML
```
The alert fires after about 30 seconds of elevated errors. Check [http://localhost:9090/alerts](http://localhost:9090/alerts).
 #### Connect OpenSRE to the lab Grafana
1. Get your machine's LAN IP:
```bash theme={null}
hostname -I | awk '{print $1}' # Linux
ipconfig getifaddr en0 # macOS
(Get-NetIPAddress -InterfaceAlias "Wi-Fi" -AddressFamily IPv4).IPAddress # Windows PowerShell
# Replace "Wi-Fi" with your interface name if needed.
```
2. Create a Grafana service account token ([Grafana docs](https://grafana.com/docs/grafana/latest/administration/service-accounts/#add-a-token-to-a-service-account-in-grafana)).
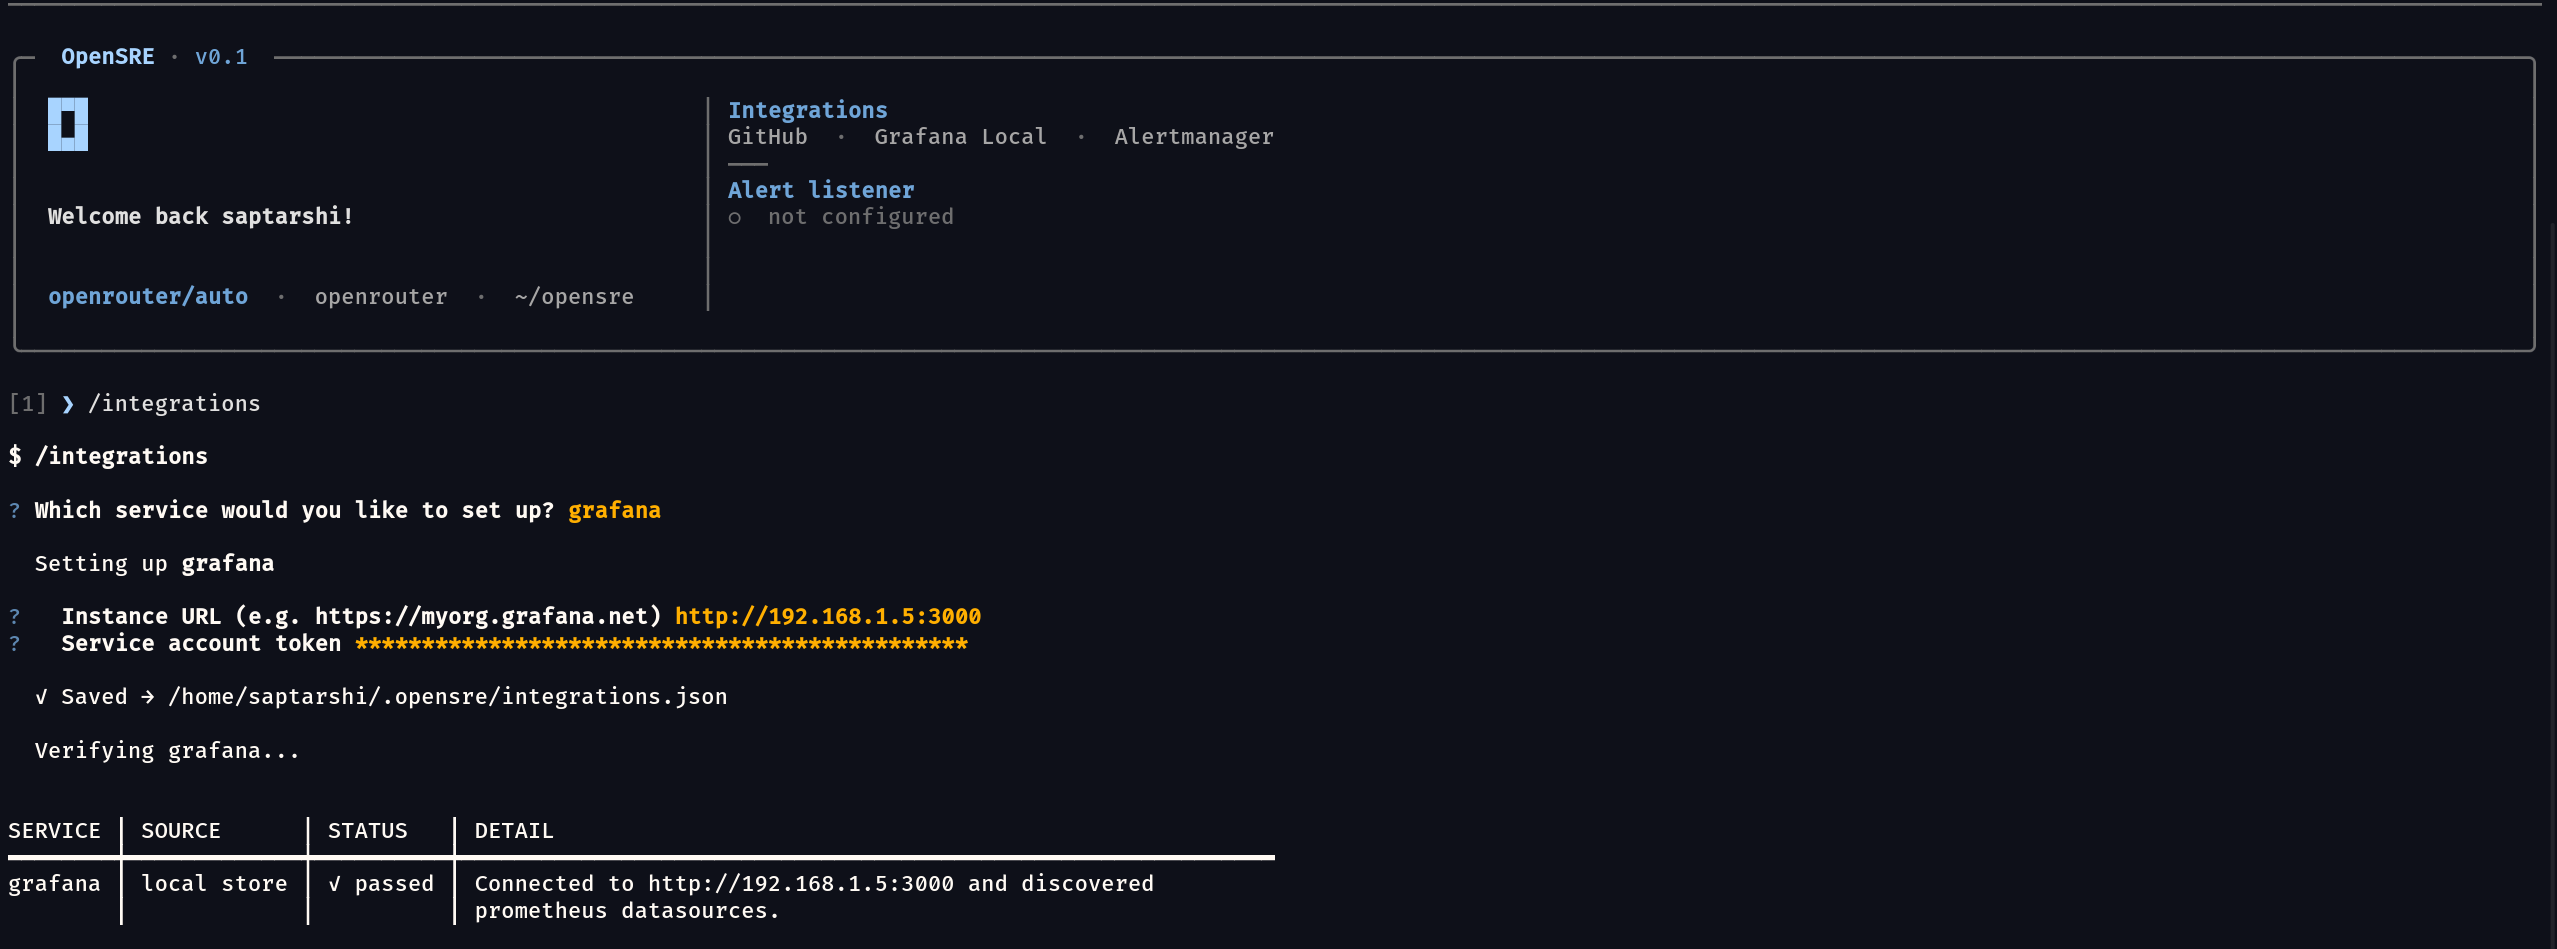
3. Run setup and enter:
```bash theme={null}
opensre integrations setup grafana
```
| Prompt | Value |
| --------------------- | ------------------------------ |
| Instance URL | `http://:3000` |
| Service account token | Token from step 2 |
For local/lab TLS issues, set `GRAFANA_VERIFY_SSL=false` or answer the SSL prompts as described in [Setup](#setup).
#### Connect OpenSRE to the lab Grafana
1. Get your machine's LAN IP:
```bash theme={null}
hostname -I | awk '{print $1}' # Linux
ipconfig getifaddr en0 # macOS
(Get-NetIPAddress -InterfaceAlias "Wi-Fi" -AddressFamily IPv4).IPAddress # Windows PowerShell
# Replace "Wi-Fi" with your interface name if needed.
```
2. Create a Grafana service account token ([Grafana docs](https://grafana.com/docs/grafana/latest/administration/service-accounts/#add-a-token-to-a-service-account-in-grafana)).
3. Run setup and enter:
```bash theme={null}
opensre integrations setup grafana
```
| Prompt | Value |
| --------------------- | ------------------------------ |
| Instance URL | `http://:3000` |
| Service account token | Token from step 2 |
For local/lab TLS issues, set `GRAFANA_VERIFY_SSL=false` or answer the SSL prompts as described in [Setup](#setup).
 ### Add Loki and Tempo for full tool coverage
The steps above give OpenSRE working metrics querying and (once a rule/annotation
exists) alert-rule and annotation querying, but log search, service-name discovery, and
trace querying need Loki and Tempo datasources, which this lab doesn't install by default.
Verified live: without them, those three capabilities return
`"Loki datasource not found"` / `"Tempo datasource not found"`, not real data.
1. Add the Grafana chart repo and install Loki (bundled with Promtail) and Tempo:
```bash theme={null}
helm repo add grafana https://grafana.github.io/helm-charts
helm repo update
helm install loki grafana/loki-stack -n monitoring --set promtail.enabled=true
helm install tempo grafana/tempo -n monitoring
kubectl -n monitoring wait --for=condition=Ready pods -l "app=loki" --timeout=180s
kubectl -n monitoring wait --for=condition=Ready pods -l "app.kubernetes.io/name=tempo" --timeout=180s
```
2. Register both as Grafana datasources (the chart doesn't auto-provision them):
```bash theme={null}
GRAFANA_PW=$(kubectl get secret kube-stack-grafana --namespace monitoring \
-o jsonpath="{.data.admin-password}" | base64 --decode)
curl -s -X POST -H "Content-Type: application/json" \
-d '{"name":"Loki","type":"loki","access":"proxy","url":"http://loki.monitoring:3100"}' \
"http://admin:${GRAFANA_PW}@localhost:3000/api/datasources"
curl -s -X POST -H "Content-Type: application/json" \
-d '{"name":"Tempo","type":"tempo","access":"proxy","url":"http://tempo.monitoring:3200"}' \
"http://admin:${GRAFANA_PW}@localhost:3000/api/datasources"
```
Promtail's default relabeling produces `job`/`namespace`/`pod`/`app` labels on log
streams, and the ServiceMonitor stack's default metric labels are `job`/`service` --
neither includes a `service_name` label. Log search and service-name discovery both
query Loki's `service_name` label specifically, and metrics querying filters on the same
label when a service name is passed, so all three return empty against an unmodified
stack even though the underlying log/metric data is present. Confirmed live: a Loki label query and a
`service_name="podinfo"` Mimir query both returned nothing until the two relabelings
below were added; a real user's own services will hit the same gap unless they already
emit or relabel a `service_name` label.
3. Add a `service_name` relabel to Promtail (derived from the pod's
`app.kubernetes.io/name` label) by upgrading the release with an extra
relabel config alongside Promtail's defaults:
```bash theme={null}
cat > /tmp/promtail-values.yaml << 'EOF'
promtail:
config:
snippets:
common:
- action: replace
source_labels: [__meta_kubernetes_pod_node_name]
target_label: node_name
- action: replace
source_labels: [__meta_kubernetes_namespace]
target_label: namespace
- action: replace
replacement: $1
separator: /
source_labels: [namespace, app]
target_label: job
- action: replace
source_labels: [__meta_kubernetes_pod_name]
target_label: pod
- action: replace
source_labels: [__meta_kubernetes_pod_container_name]
target_label: container
- action: replace
source_labels: [__meta_kubernetes_pod_label_app_kubernetes_io_name]
target_label: service_name
- action: replace
replacement: /var/log/pods/*$1/*.log
separator: /
source_labels: [__meta_kubernetes_pod_uid, __meta_kubernetes_pod_container_name]
target_label: __path__
EOF
helm upgrade loki grafana/loki-stack -n monitoring -f /tmp/promtail-values.yaml \
--set promtail.enabled=true --reuse-values
```
Keep the heredoc terminator (`EOF`) flush against the left margin, not indented to
match this list item -- `<<'EOF'` requires an exact, unindented match to end the
here-document. An indented closing line is swallowed as YAML content instead of
ending the file, and the `helm upgrade` line after it gets swallowed too, silently
turning into dead text inside the values file instead of running. Confirmed live
by copy-pasting an indented version of this exact block.
4. Enable request tracing on podinfo -- it ships an OpenTelemetry exporter but keeps
it disabled until both `--otel-service-name` and an OTLP endpoint are set (the
chart's `extraEnvs` alone is not enough; confirmed via `podinfo --help`, which
states tracing is disabled unless `--otel-service-name` is set):
```bash theme={null}
cat > /tmp/podinfo-tracing-values.yaml << 'EOF'
serviceMonitor:
enabled: true
extraArgs:
- "--otel-service-name=podinfo"
extraEnvs:
- name: OTEL_EXPORTER_OTLP_TRACES_ENDPOINT
value: "http://tempo.monitoring:4317"
EOF
helm upgrade podinfo podinfo/podinfo -n podinfo -f /tmp/podinfo-tracing-values.yaml
kubectl -n podinfo wait --for=condition=Ready pods --all --timeout=60s
```
The upgrade replaces the podinfo pod, so re-run the port-forward from
[Steps](#steps) (step 6) if it's still attached to the old pod.
5. Add the same `service_name` relabel to the podinfo ServiceMonitor for metrics
(`kubectl patch` here, since the podinfo chart doesn't expose `metricRelabelings`
as a values key):
```bash theme={null}
kubectl patch servicemonitor podinfo -n podinfo --type=json -p '[{
"op": "add",
"path": "/spec/endpoints/0/metricRelabelings",
"value": [{"sourceLabels": ["job"], "targetLabel": "service_name"}]
}]'
```
Do this **after** the tracing upgrade above, not before. `helm upgrade` re-applies
the ServiceMonitor via server-side apply; if `kubectl patch` already owns
`.spec.endpoints` from a prior patch, a later `helm upgrade podinfo` fails with
`Apply failed with 1 conflict: conflict with "kubectl-patch"`. Confirmed live by
running these two steps in the opposite order.
6. Generate some traffic so there's real data for every tool, then confirm each
datasource actually has it:
```bash theme={null}
for i in $(seq 1 10); do curl -s http://localhost:8080/ >/dev/null; done
for i in $(seq 1 5); do curl -s http://localhost:8080/status/500 >/dev/null; done
```
### Ask the agent
```bash theme={null}
opensre integrations verify grafana
```
```
SERVICE │ SOURCE │ STATUS │ DETAIL
grafana │ local env │ ✓ passed │ Connected to http://localhost:3000 and
│ │ │ discovered loki, prometheus, tempo datasources.
```
Then start `opensre` and ask about the failing app from [Steps](#steps), e.g.
*Why is podinfo's error rate high? Check Grafana logs, metrics, and traces.*
All 6 registered tools return real data against this lab once the datasources and
relabelings above are in place -- confirmed by direct calls to each tool: metrics
querying (real `http_requests_total` series, `service_name="podinfo"`), log search (real
podinfo log lines), trace querying (real spans like `GET /status/{code:[0-9]+}` from the
generated load), service-name discovery (`["podinfo", ...]`), alert-rule querying (the
rule created via `/api/v1/provisioning/alert-rules` below), and annotation querying (an
annotation created via `/api/annotations`).
Alert-rule and annotation querying use Grafana's own
alerting/annotation APIs, not the raw `PrometheusRule` CRD from
[Prometheus alert for high error rate](#prometheus-alert-for-high-error-rate) -- that
CRD is evaluated by Prometheus itself and never becomes a Grafana-managed rule.
To exercise these two tools with real data, create a rule and annotation through
Grafana directly, for example:
```bash theme={null}
GRAFANA_PW=$(kubectl get secret kube-stack-grafana --namespace monitoring \
-o jsonpath="{.data.admin-password}" | base64 --decode)
FOLDER_UID=$(curl -s -X POST -H "Content-Type: application/json" \
-d '{"title":"podinfo-alerts"}' \
"http://admin:${GRAFANA_PW}@localhost:3000/api/folders" | python3 -c 'import json,sys; print(json.load(sys.stdin)["uid"])')
curl -s -X POST -H "Content-Type: application/json" \
-d "{
\"title\": \"PodinfoHighErrorRateGrafana\", \"ruleGroup\": \"podinfo-group\",
\"folderUID\": \"${FOLDER_UID}\", \"condition\": \"B\", \"noDataState\": \"NoData\",
\"execErrState\": \"Error\", \"for\": \"30s\",
\"data\": [
{\"refId\": \"A\", \"relativeTimeRange\": {\"from\": 300, \"to\": 0}, \"datasourceUid\": \"prometheus\",
\"model\": {\"expr\": \"increase(http_requests_total{status=\\\"500\\\"}[5m])\", \"refId\": \"A\", \"instant\": true}},
{\"refId\": \"B\", \"relativeTimeRange\": {\"from\": 0, \"to\": 0}, \"datasourceUid\": \"__expr__\",
\"model\": {\"type\": \"threshold\", \"expression\": \"A\", \"conditions\": [{\"evaluator\": {\"type\": \"gt\", \"params\": [5]}}], \"refId\": \"B\"}}
]
}" \
"http://admin:${GRAFANA_PW}@localhost:3000/api/v1/provisioning/alert-rules"
curl -s -X POST -H "Content-Type: application/json" \
-d "{\"text\":\"podinfo v6.14.1 deployed with tracing enabled\",\"tags\":[\"deployment\",\"podinfo\"],\"time\":$(($(date +%s) * 1000))}" \
"http://admin:${GRAFANA_PW}@localhost:3000/api/annotations"
```
### Teardown
```bash theme={null}
kind delete cluster --name grafana-lab # or: minikube delete
```
If you started separate port-forward terminals per [Steps](#steps), `Ctrl-C` each one
first (deleting the cluster also kills them, but not always cleanly on every platform).
### Add Loki and Tempo for full tool coverage
The steps above give OpenSRE working metrics querying and (once a rule/annotation
exists) alert-rule and annotation querying, but log search, service-name discovery, and
trace querying need Loki and Tempo datasources, which this lab doesn't install by default.
Verified live: without them, those three capabilities return
`"Loki datasource not found"` / `"Tempo datasource not found"`, not real data.
1. Add the Grafana chart repo and install Loki (bundled with Promtail) and Tempo:
```bash theme={null}
helm repo add grafana https://grafana.github.io/helm-charts
helm repo update
helm install loki grafana/loki-stack -n monitoring --set promtail.enabled=true
helm install tempo grafana/tempo -n monitoring
kubectl -n monitoring wait --for=condition=Ready pods -l "app=loki" --timeout=180s
kubectl -n monitoring wait --for=condition=Ready pods -l "app.kubernetes.io/name=tempo" --timeout=180s
```
2. Register both as Grafana datasources (the chart doesn't auto-provision them):
```bash theme={null}
GRAFANA_PW=$(kubectl get secret kube-stack-grafana --namespace monitoring \
-o jsonpath="{.data.admin-password}" | base64 --decode)
curl -s -X POST -H "Content-Type: application/json" \
-d '{"name":"Loki","type":"loki","access":"proxy","url":"http://loki.monitoring:3100"}' \
"http://admin:${GRAFANA_PW}@localhost:3000/api/datasources"
curl -s -X POST -H "Content-Type: application/json" \
-d '{"name":"Tempo","type":"tempo","access":"proxy","url":"http://tempo.monitoring:3200"}' \
"http://admin:${GRAFANA_PW}@localhost:3000/api/datasources"
```
Promtail's default relabeling produces `job`/`namespace`/`pod`/`app` labels on log
streams, and the ServiceMonitor stack's default metric labels are `job`/`service` --
neither includes a `service_name` label. Log search and service-name discovery both
query Loki's `service_name` label specifically, and metrics querying filters on the same
label when a service name is passed, so all three return empty against an unmodified
stack even though the underlying log/metric data is present. Confirmed live: a Loki label query and a
`service_name="podinfo"` Mimir query both returned nothing until the two relabelings
below were added; a real user's own services will hit the same gap unless they already
emit or relabel a `service_name` label.
3. Add a `service_name` relabel to Promtail (derived from the pod's
`app.kubernetes.io/name` label) by upgrading the release with an extra
relabel config alongside Promtail's defaults:
```bash theme={null}
cat > /tmp/promtail-values.yaml << 'EOF'
promtail:
config:
snippets:
common:
- action: replace
source_labels: [__meta_kubernetes_pod_node_name]
target_label: node_name
- action: replace
source_labels: [__meta_kubernetes_namespace]
target_label: namespace
- action: replace
replacement: $1
separator: /
source_labels: [namespace, app]
target_label: job
- action: replace
source_labels: [__meta_kubernetes_pod_name]
target_label: pod
- action: replace
source_labels: [__meta_kubernetes_pod_container_name]
target_label: container
- action: replace
source_labels: [__meta_kubernetes_pod_label_app_kubernetes_io_name]
target_label: service_name
- action: replace
replacement: /var/log/pods/*$1/*.log
separator: /
source_labels: [__meta_kubernetes_pod_uid, __meta_kubernetes_pod_container_name]
target_label: __path__
EOF
helm upgrade loki grafana/loki-stack -n monitoring -f /tmp/promtail-values.yaml \
--set promtail.enabled=true --reuse-values
```
Keep the heredoc terminator (`EOF`) flush against the left margin, not indented to
match this list item -- `<<'EOF'` requires an exact, unindented match to end the
here-document. An indented closing line is swallowed as YAML content instead of
ending the file, and the `helm upgrade` line after it gets swallowed too, silently
turning into dead text inside the values file instead of running. Confirmed live
by copy-pasting an indented version of this exact block.
4. Enable request tracing on podinfo -- it ships an OpenTelemetry exporter but keeps
it disabled until both `--otel-service-name` and an OTLP endpoint are set (the
chart's `extraEnvs` alone is not enough; confirmed via `podinfo --help`, which
states tracing is disabled unless `--otel-service-name` is set):
```bash theme={null}
cat > /tmp/podinfo-tracing-values.yaml << 'EOF'
serviceMonitor:
enabled: true
extraArgs:
- "--otel-service-name=podinfo"
extraEnvs:
- name: OTEL_EXPORTER_OTLP_TRACES_ENDPOINT
value: "http://tempo.monitoring:4317"
EOF
helm upgrade podinfo podinfo/podinfo -n podinfo -f /tmp/podinfo-tracing-values.yaml
kubectl -n podinfo wait --for=condition=Ready pods --all --timeout=60s
```
The upgrade replaces the podinfo pod, so re-run the port-forward from
[Steps](#steps) (step 6) if it's still attached to the old pod.
5. Add the same `service_name` relabel to the podinfo ServiceMonitor for metrics
(`kubectl patch` here, since the podinfo chart doesn't expose `metricRelabelings`
as a values key):
```bash theme={null}
kubectl patch servicemonitor podinfo -n podinfo --type=json -p '[{
"op": "add",
"path": "/spec/endpoints/0/metricRelabelings",
"value": [{"sourceLabels": ["job"], "targetLabel": "service_name"}]
}]'
```
Do this **after** the tracing upgrade above, not before. `helm upgrade` re-applies
the ServiceMonitor via server-side apply; if `kubectl patch` already owns
`.spec.endpoints` from a prior patch, a later `helm upgrade podinfo` fails with
`Apply failed with 1 conflict: conflict with "kubectl-patch"`. Confirmed live by
running these two steps in the opposite order.
6. Generate some traffic so there's real data for every tool, then confirm each
datasource actually has it:
```bash theme={null}
for i in $(seq 1 10); do curl -s http://localhost:8080/ >/dev/null; done
for i in $(seq 1 5); do curl -s http://localhost:8080/status/500 >/dev/null; done
```
### Ask the agent
```bash theme={null}
opensre integrations verify grafana
```
```
SERVICE │ SOURCE │ STATUS │ DETAIL
grafana │ local env │ ✓ passed │ Connected to http://localhost:3000 and
│ │ │ discovered loki, prometheus, tempo datasources.
```
Then start `opensre` and ask about the failing app from [Steps](#steps), e.g.
*Why is podinfo's error rate high? Check Grafana logs, metrics, and traces.*
All 6 registered tools return real data against this lab once the datasources and
relabelings above are in place -- confirmed by direct calls to each tool: metrics
querying (real `http_requests_total` series, `service_name="podinfo"`), log search (real
podinfo log lines), trace querying (real spans like `GET /status/{code:[0-9]+}` from the
generated load), service-name discovery (`["podinfo", ...]`), alert-rule querying (the
rule created via `/api/v1/provisioning/alert-rules` below), and annotation querying (an
annotation created via `/api/annotations`).
Alert-rule and annotation querying use Grafana's own
alerting/annotation APIs, not the raw `PrometheusRule` CRD from
[Prometheus alert for high error rate](#prometheus-alert-for-high-error-rate) -- that
CRD is evaluated by Prometheus itself and never becomes a Grafana-managed rule.
To exercise these two tools with real data, create a rule and annotation through
Grafana directly, for example:
```bash theme={null}
GRAFANA_PW=$(kubectl get secret kube-stack-grafana --namespace monitoring \
-o jsonpath="{.data.admin-password}" | base64 --decode)
FOLDER_UID=$(curl -s -X POST -H "Content-Type: application/json" \
-d '{"title":"podinfo-alerts"}' \
"http://admin:${GRAFANA_PW}@localhost:3000/api/folders" | python3 -c 'import json,sys; print(json.load(sys.stdin)["uid"])')
curl -s -X POST -H "Content-Type: application/json" \
-d "{
\"title\": \"PodinfoHighErrorRateGrafana\", \"ruleGroup\": \"podinfo-group\",
\"folderUID\": \"${FOLDER_UID}\", \"condition\": \"B\", \"noDataState\": \"NoData\",
\"execErrState\": \"Error\", \"for\": \"30s\",
\"data\": [
{\"refId\": \"A\", \"relativeTimeRange\": {\"from\": 300, \"to\": 0}, \"datasourceUid\": \"prometheus\",
\"model\": {\"expr\": \"increase(http_requests_total{status=\\\"500\\\"}[5m])\", \"refId\": \"A\", \"instant\": true}},
{\"refId\": \"B\", \"relativeTimeRange\": {\"from\": 0, \"to\": 0}, \"datasourceUid\": \"__expr__\",
\"model\": {\"type\": \"threshold\", \"expression\": \"A\", \"conditions\": [{\"evaluator\": {\"type\": \"gt\", \"params\": [5]}}], \"refId\": \"B\"}}
]
}" \
"http://admin:${GRAFANA_PW}@localhost:3000/api/v1/provisioning/alert-rules"
curl -s -X POST -H "Content-Type: application/json" \
-d "{\"text\":\"podinfo v6.14.1 deployed with tracing enabled\",\"tags\":[\"deployment\",\"podinfo\"],\"time\":$(($(date +%s) * 1000))}" \
"http://admin:${GRAFANA_PW}@localhost:3000/api/annotations"
```
### Teardown
```bash theme={null}
kind delete cluster --name grafana-lab # or: minikube delete
```
If you started separate port-forward terminals per [Steps](#steps), `Ctrl-C` each one
first (deleting the cluster also kills them, but not always cleanly on every platform).